Hedera's Surge Validates FedNow Buzz; Could HBAR Slash a Zero?
- The Cryptoverse
- Aug 16, 2023
- 2 min read

The recent announcement of FedNow listing Dropp, the micropayment platform built on the
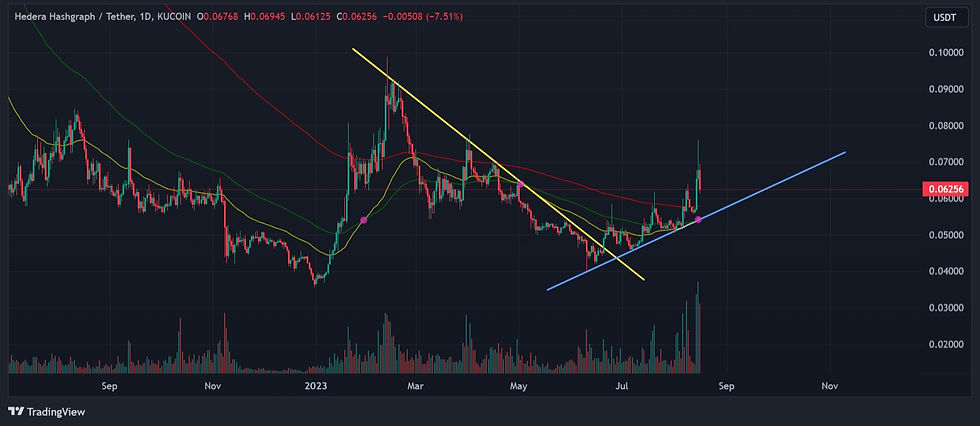
Hedera (HBAR) Network, as a service provider, has ignited great excitement among HBAR holders regarding its potential positive impact on the cryptocurrency. The primary question on HBAR holders' minds likely revolves around the token’s upward potential. With this development (the FedNow Hype) as the probable catalyst, a bullish trend seems to be underway, marked by a breakout above a local resistance of 0.064 cents that is already in motion.

With 3.9 billion tokens exchanged on Binance alone in the past three days, as reported by tradingview.com, HBAR has demonstrated a 32% increase (from the low to the high within the 3-day period), followed by the daily 50 EMA crossing above the 100 EMA. This cross suggests further bullish upswing on the horizon.

For Elliott Wave enthusiasts, it could be a good time to initiate your wave count and establish Fibonacci extensions to gauge potential impulsive waves on the horizon. However, this is applicable only if the bullish momentum remains intact and doesn't fail while retesting the current 0.075 resistance level, potentially forming a head and shoulders pattern in the process.
This Technical Score Widget is provided by Quantify Crypto for
educational purposes and should not be considered financial advice.
The MACD hasn't exhibited signs of exhaustion and appears poised for upward movement. The RSI might persist above the 70% overbought range until indications of divergence emerge.

With HBAR breaking out of the persistent February-June 2023 downtrend, the true test for this fresh bullish momentum would be the strength of the current uptrend line in play - remember anything can happen in cryptocurrency markets; always conduct your own due diligence.

DISCLAIMER: This article is solely for informational purposes and not for financial, investment, or trading advice, and should not be relied upon for making decisions. Furthermore, thecryptoverse.online has positions in the cryptocurrency mentioned in this article. For more see our full disclosure here.


Comments